Artificial intelligence (AI) may feel simple when you use a chatbot, but behind the scenes there is a complex chain of technologies and businesses making it all possible. This chain has become one of the biggest themes shaping financial markets and the economy today. For investors, understanding AI means looking beyond just a handful of technology stocks. AI is clearly a transformational technology, but it is still hard to predict exactly how it will affect businesses, workers, and productivity in the years ahead. This uncertainty can make it difficult to assess the value of companies and the broader stock market. So, how can investors build a clearer picture of AI's impact while keeping a long-term focus? The full AI supply chain is supporting markets
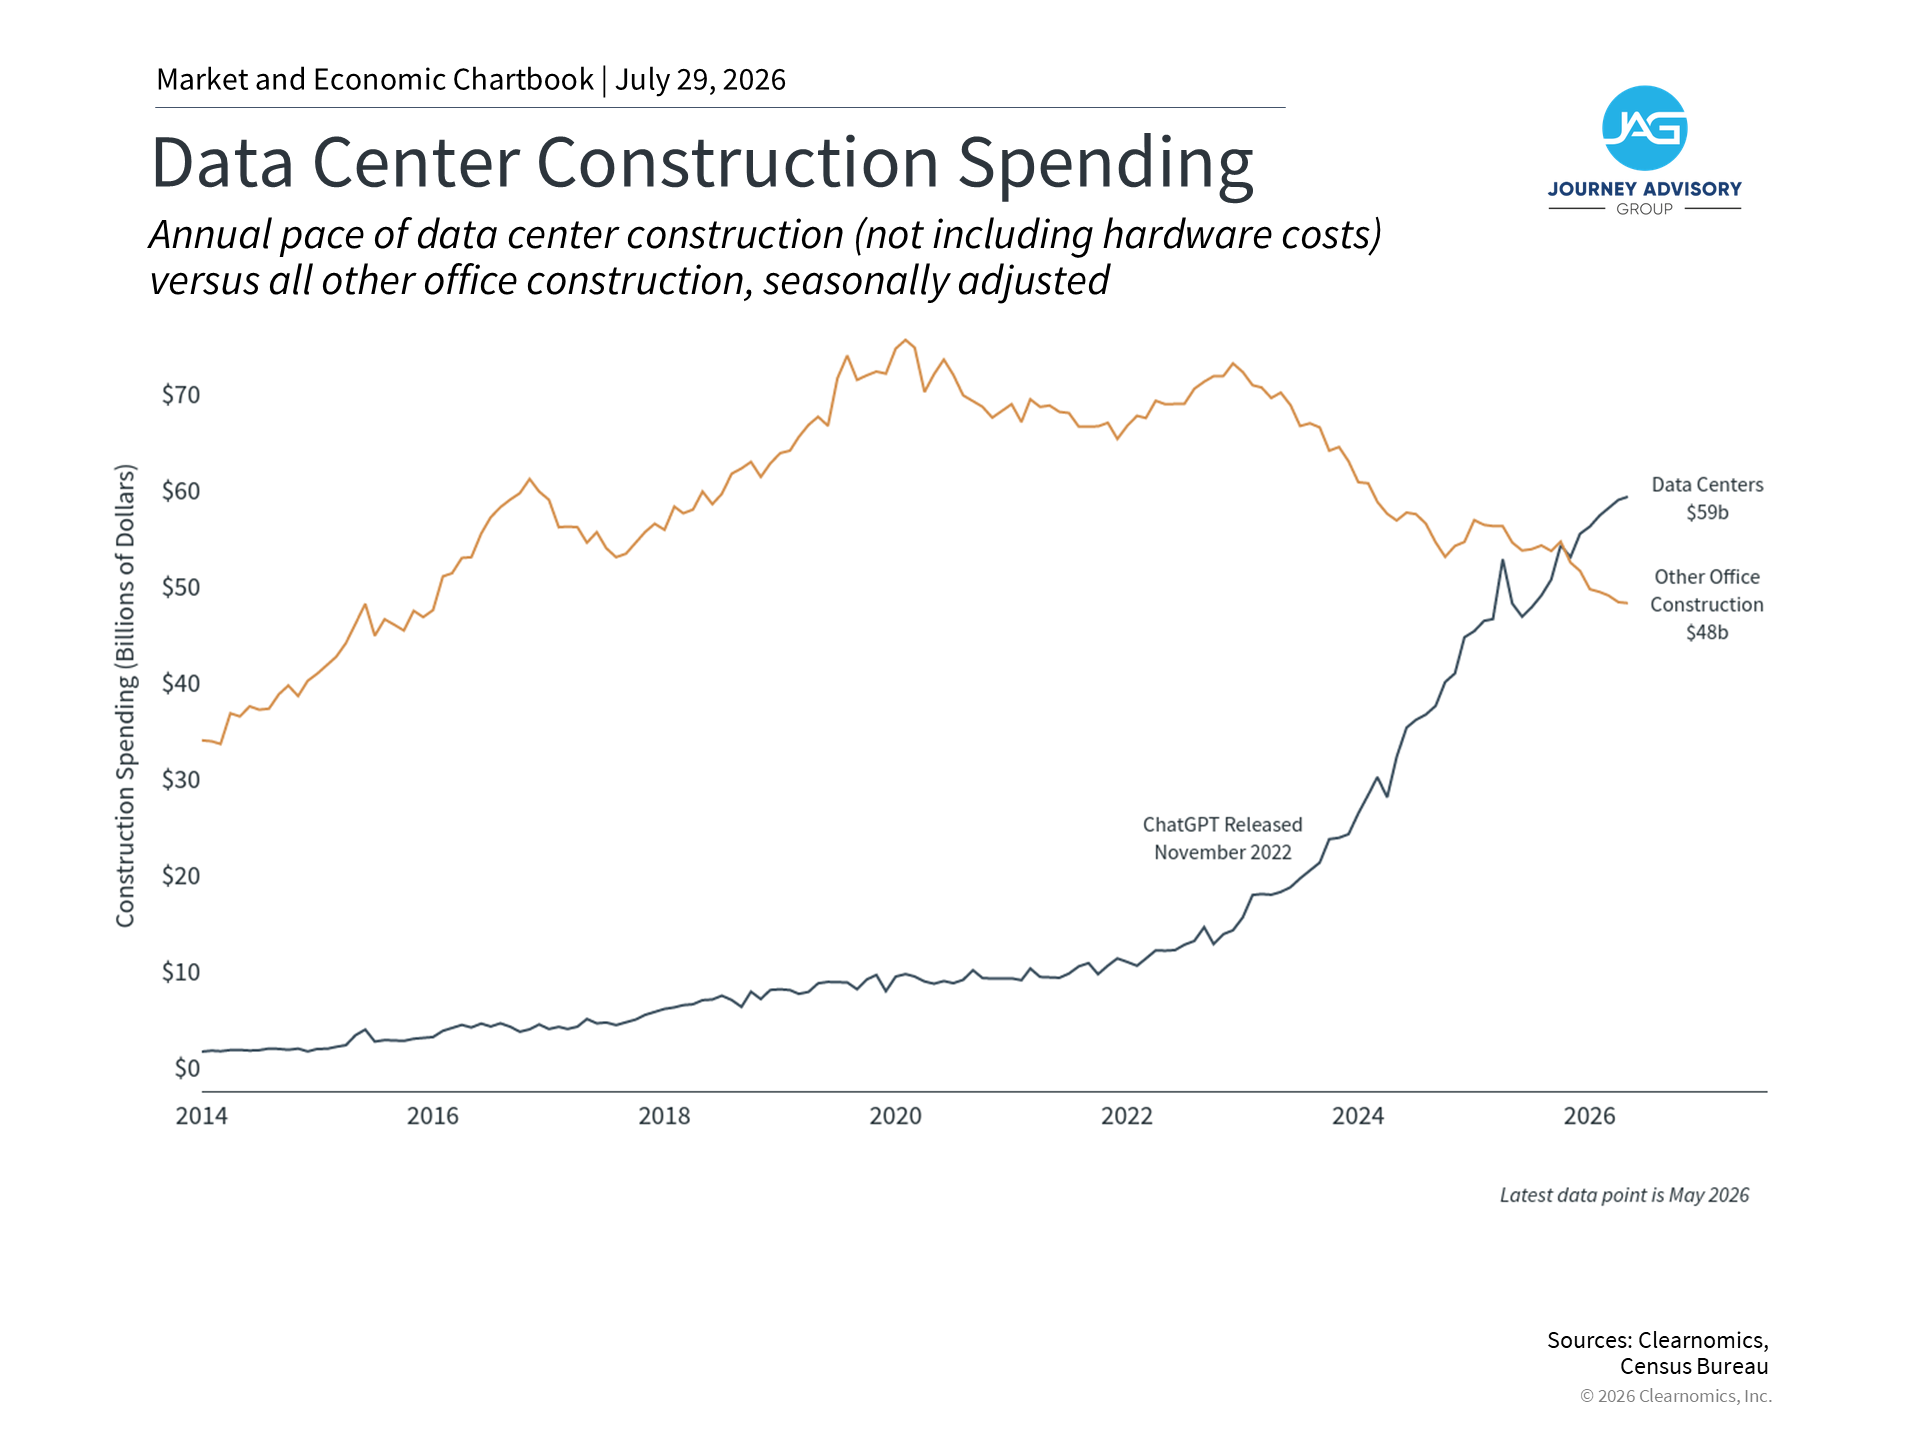
One key insight for investors is that "AI" is not a single investment. It covers a wide range of activities and industries, including hardware, data centers, software, and the companies that build AI models. Each part of this supply chain has its own characteristics and risks. At the base of it all are semiconductors, which are the specialized computer chips (such as GPUs) that power AI. These chips are needed both to build AI models and to run them when people use them. Building a model requires enormous amounts of data processed across thousands of servers over weeks or months. Running the model, known as "inference," requires computing power every time someone asks it a question. This demand has pushed chip prices and valuations higher. Data centers are large facilities packed with servers that run around the clock, requiring power, cooling, and security. Spending on data center construction has surged since the launch of ChatGPT in late 2022 and has surpassed all other types of office construction. It is worth noting that not all of this growth is strictly due to AI. General technology adoption, especially since 2020, has also increased demand for computing resources.1 Will large AI investments generate sufficient returns?2
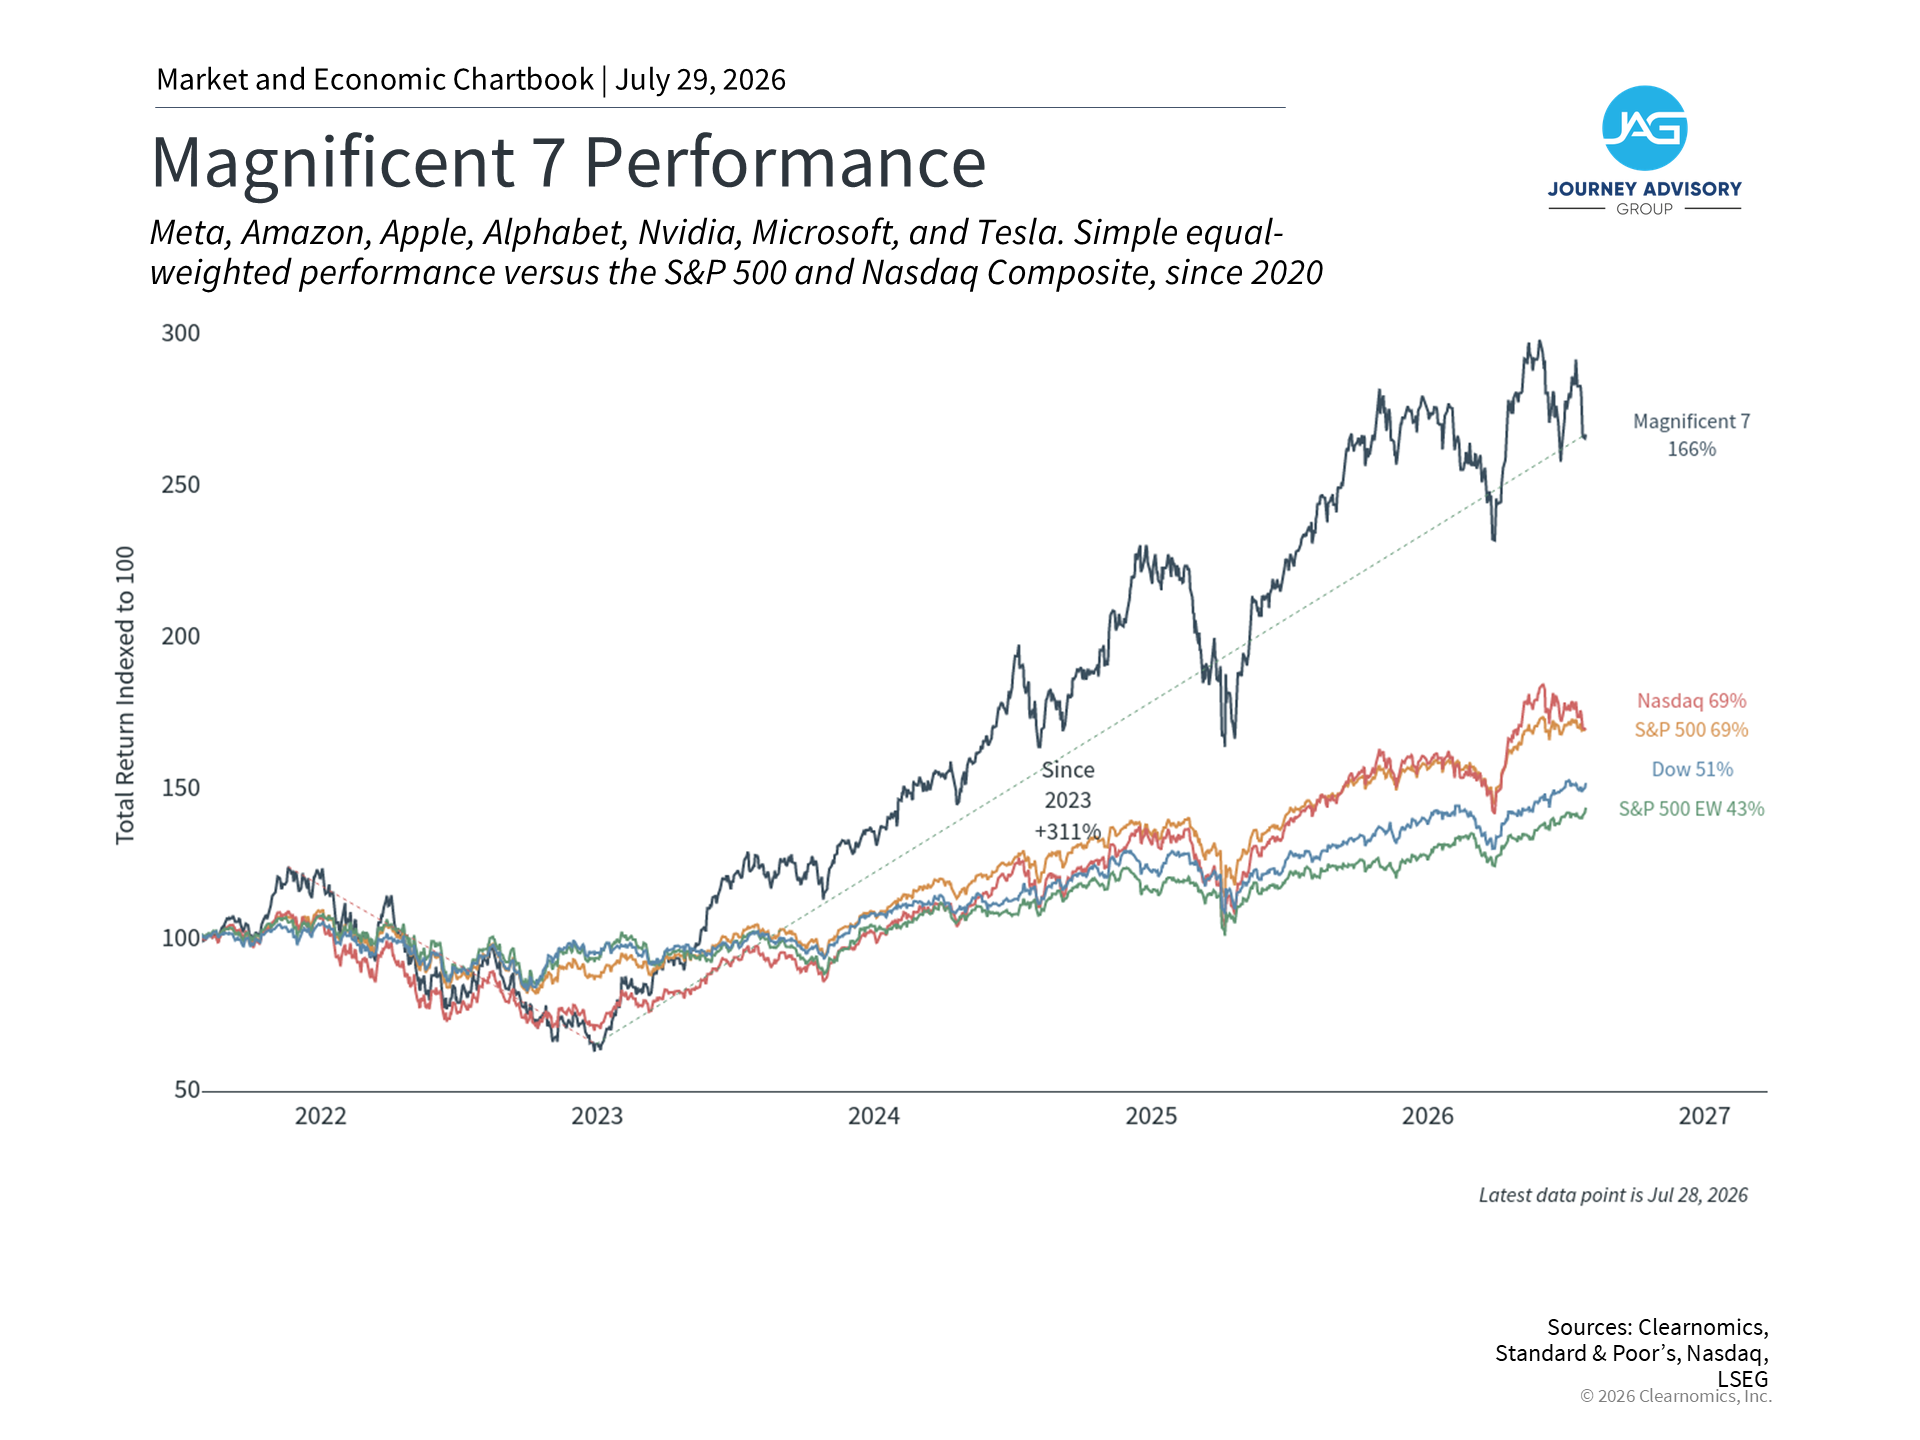
A central question for investors is whether the hundreds of billions of dollars being spent on AI infrastructure will eventually produce strong enough returns. As AI models improve, they may also become more efficient, potentially needing less computing power over time. This uncertainty has contributed to large swings in AI-related stocks. Mega-cap technology stocks have posted strong returns in recent years but with significant volatility along the way. History also shows that efficiency gains from new technologies do not always reduce overall demand. This is sometimes called the "Jevons paradox," where cheaper and more capable technology leads to broader adoption and new uses. At the same time, markets have often overestimated how quickly new technologies generate profits, even when the long-term potential is real. The enthusiasm for internet stocks in the late 1990s took decades to fully play out, which is a useful reminder to keep a long-term perspective. High valuations reflect strong expectations for AI growth
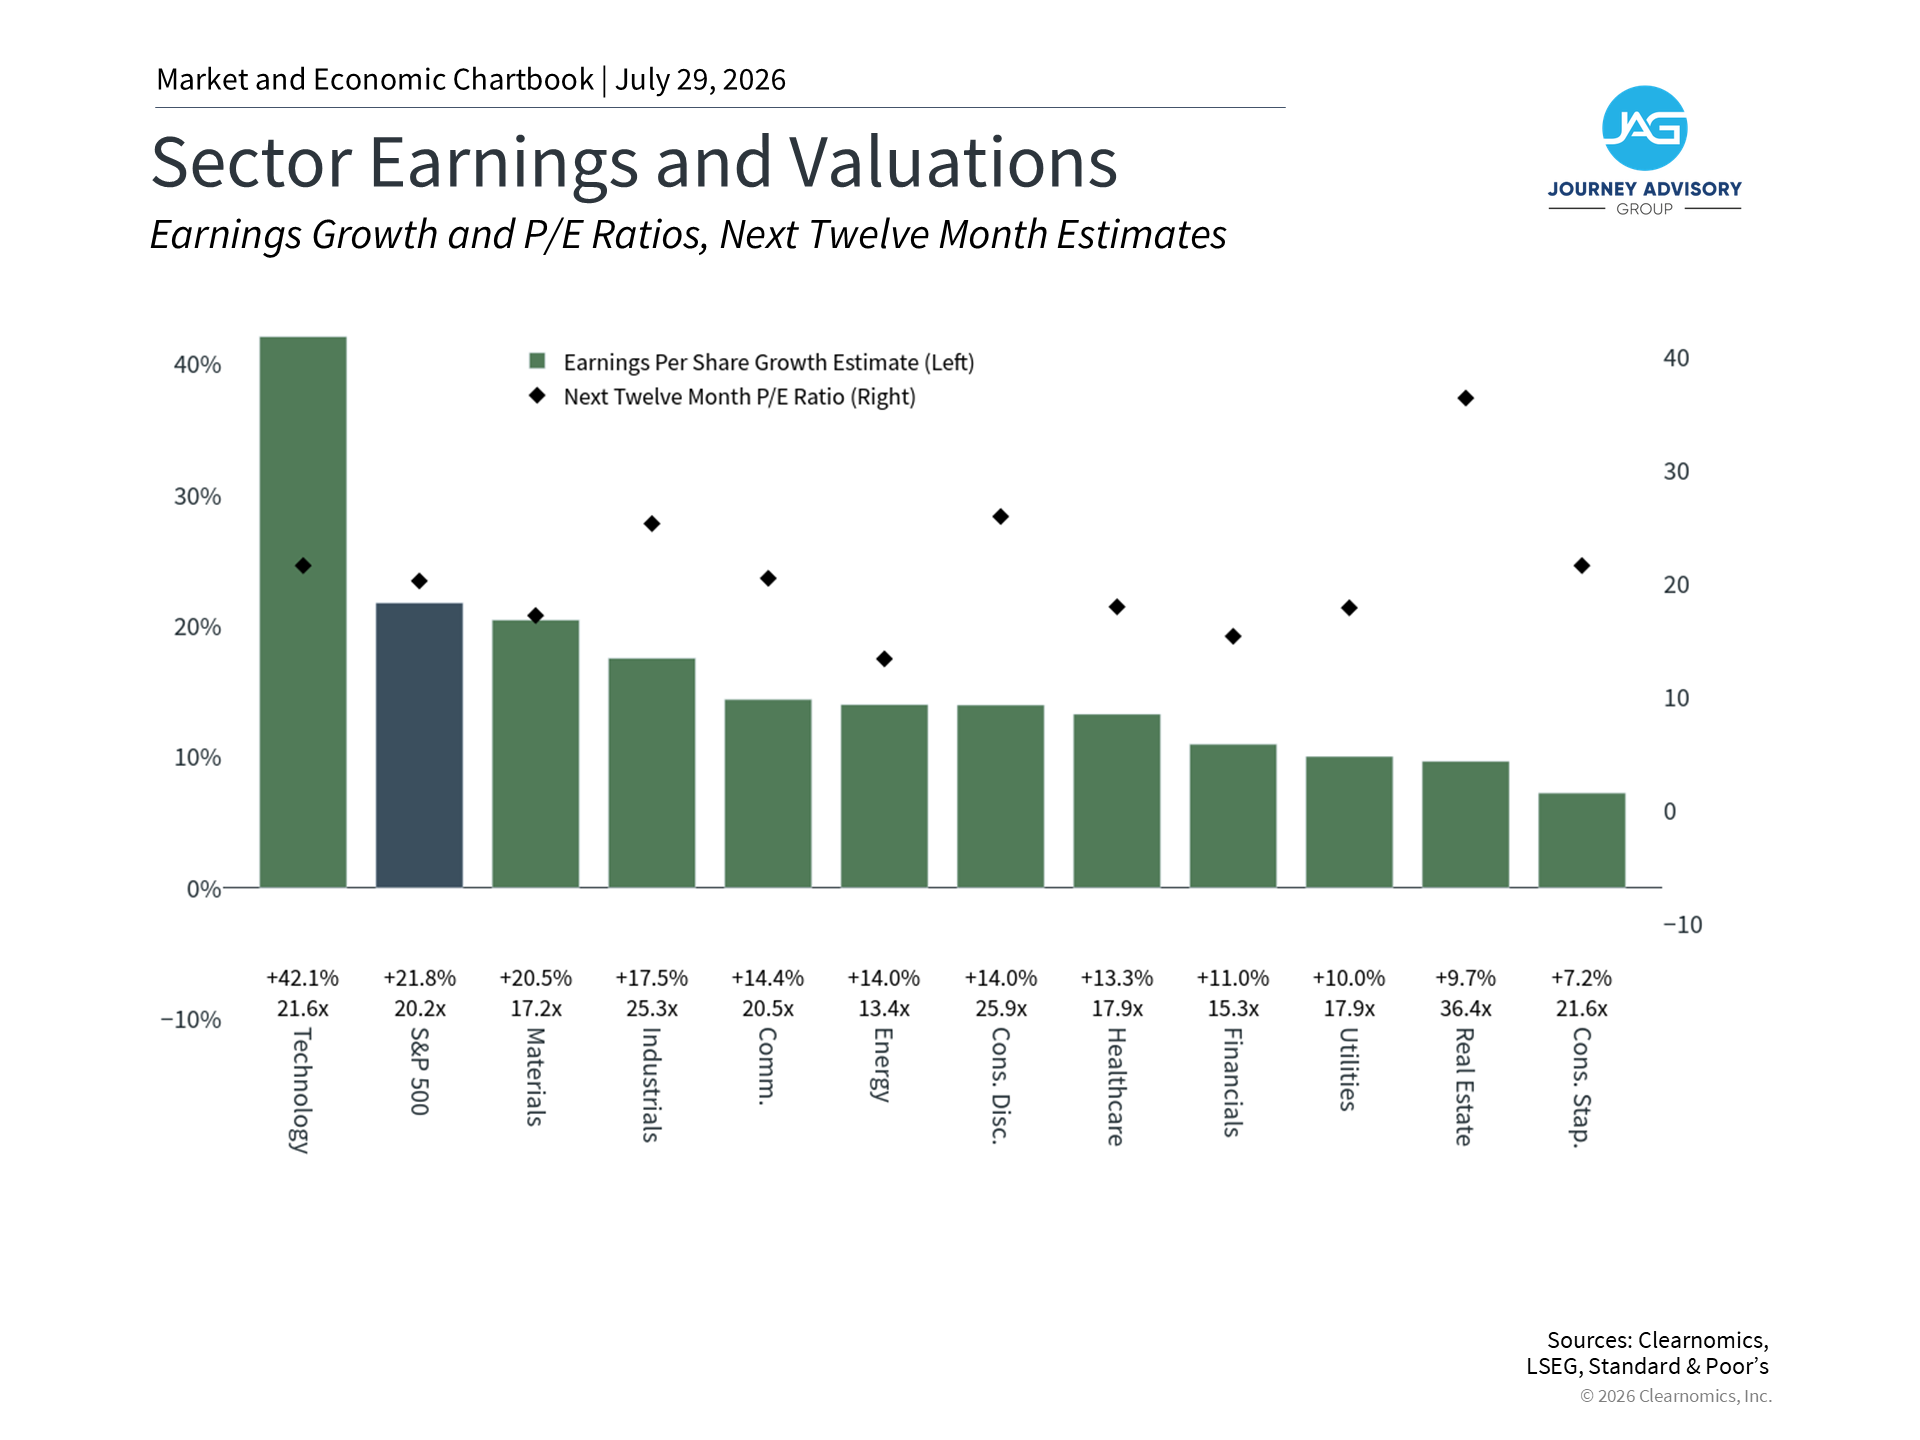
As AI has attracted investor attention, valuations (which measure how expensive a stock is relative to its earnings) have risen for many technology companies. The Information Technology sector currently trades at 21.4x earnings, which is high compared to its own history and the broader market. Sectors such as Communication Services and Consumer Discretionary, which also include large technology companies, show similar patterns. These elevated valuations reflect strong earnings growth driven by AI demand.3 Valuations are not a tool for predicting short-term market moves. Instead, they can help guide decisions about how to balance a portfolio in line with your financial goals. Many sectors outside of technology are attractively valued and also have strong earnings growth potential. Balancing AI-related opportunities with other parts of the market is key to working toward long-term financial goals. The bottom line? The trends driving AI go beyond a few technology companies. While these themes are driving markets, it's important to maintain a broader perspective and longer time horizon with a focus on long-term financial goals. References 1. https://www.census.gov/construction/c30/c30index.html 2. The Magnificent 7 companies include Meta, Amazon, Apple, Alphabet, Nvidia, Microsoft, and Tesla. Data as of July 17, 2026 3. Clearnomics research and LSEG data as of July 17, 2026 Index Descriptions S&P 500 The Standard & Poor's 500 Index is a capitalization-weighted index of 500 stocks designed to measure performance of the broad domestic economy through changes in the aggregate market value of 500 stocks representing all major industries. NASDAQ The NASDAQ Composite Index measures all NASDAQ domestic and non-U.S. based common stocks listed on The NASDAQ Stock Market. The market value, the last sale price multiplied by total shares outstanding, is calculated throughout the trading day, and is related to the total value of the Index. | |||
This material prepared by Journey Advisory Group is for informational purposes only. It is not intended to serve as a substitute for personalized investment advice or as a recommendation or solicitation of any particular security, strategy or investment product. Economies and markets fluctuate. Facts presented have been obtained from sources believed to be reliable. Journey Advisory Group, however, cannot guarantee the accuracy or completeness of such information, and certain information may have been condensed or summarized from its original source. Past performance is not an indicator of future results. Copyright (c) 2026 Clearnomics, Inc. All rights reserved. The information contained herein has been obtained from sources believed to be reliable, but is not necessarily complete and its accuracy cannot be guaranteed. No representation or warranty, express or implied, is made as to the fairness, accuracy, completeness, or correctness of the information and opinions contained herein. The views and the other information provided are subject to change without notice. All reports posted on or via www.clearnomics.com or any affiliated websites, applications, or services are issued without regard to the specific investment objectives, financial situation, or particular needs of any specific recipient and are not to be construed as a solicitation or an offer to buy or sell any securities or related financial instruments. Past performance is not necessarily a guide to future results. Company fundamentals and earnings may be mentioned occasionally, but should not be construed as a recommendation to buy, sell, or hold the company's stock. Predictions, forecasts, and estimates for any and all markets should not be construed as recommendations to buy, sell, or hold any security--including mutual funds, futures contracts, and exchange traded funds, or any similar instruments. The text, images, and other materials contained or displayed in this report are proprietary to Clearnomics, Inc. and constitute valuable intellectual property. All unauthorized reproduction or other use of material from Clearnomics, Inc. shall be deemed willful infringement(s) of this copyright and other proprietary and intellectual property rights, including but not limited to, rights of privacy. Clearnomics, Inc. expressly reserves all rights in connection with its intellectual property, including without limitation the right to block the transfer of its products and services and/or to track usage thereof, through electronic tracking technology, and all other lawful means, now known or hereafter devised. Clearnomics, Inc. reserves the right, without further notice, to pursue to the fullest extent allowed by the law any and all criminal and civil remedies for the violation of its rights.  |

AI Investing Explained: How Semiconductors, Data Centers, and Technology Stocks Are Driving Growth